An Analysis of Local Hotels on Tourism Destination Image in China
1.1 Background and the Purpose of Research
Filipova (2016) states the hotel product is of determining importance with regard to tourism. It is a main part of the tourism product (Madgerova 2013). Within this sense, V. Kyurova indicates that this product is a basic component of the whole tourism product used by the end consumer (Kyurova 2011). Tourism industry is increasingly developing in recent years in China which stimulate the development of local hotels. According to the World Tourism Organization, it is forecast that China will become the world’s number one tourism destination by 2020. While China’s hotel industry has only existed since 1978 as the result of implementation of Reform and Opening-up policy. With sustainable growth of economy as well as increased leisure and development of transportation, people have more means and opportunities to spend some days enjoying themselves from work and study, China’s tourism and hotel industry has unprecedented development in recent years. Additionally, China’s own increasingly growth of population boost the development of domestic tourism. China inbound tourism developed with a steady growth in the first half of 2016. There were around 67.87 million overseas visitors came to China, which showed a 3.8% growth over the same period in 2015 (Table 1.1). Besides, overnight visitors increased to 28.87 million and it has 4.3% growth compared to 2015. The total inbound tourism revenue was around USD 57 billion, which increased by 5.3% over the same period of 2015. (Table 1.2).
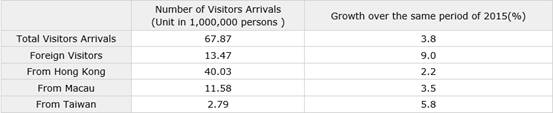
Table1. 1 Visitors arrivals statistics: 2016
*Source: Travel China Guide. Com
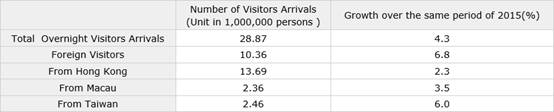
Table1. 2 Overnight visitor arrivals statistics: 2016
*Source: Travel China Guide.com
Moreover, based on China National Tourism Administration (CNTA, 2014) data, China is home to 11,687 star hotels in the end of 2013 with an annual growth of 2.82%. Up to the end of 2013, star hotels presented in general an olive-shaped distribution structure. Specifically, there were 739 five-star hotels, 2,361 four-stars hotels, 5631 three-star hotels and 2831 two-star hotels and 125 one-star hotels. From this, it is clearly to show that the big market of Chinese hotels and there are abundant facilities for customers to use when they are on holiday in China.
From the perspective of local hotels’ prospect, with the dominant development of Chinese tourism industry, there is increasingly growth of needs to leisure holiday hotels and it is clearly to see the bright future of hotel industry in China. In term of Chinese economy transition and consumption upgrade background in China, it is golden period to accelerate the growth of hotel industry in the next few years. And in the acceleration of technology, it is important that hotels apply advanced technology to promote their competitiveness. Advanced technology can be applied in hotel rooms, marketing, saving energy, service and in other aspects which not only can bring convenience to the daily management of hotels but also can provide customers new accommodation experience. Therefore, new technology applied in hotel management will be a significant means to improve competitiveness in the future.
Although there is bright future of hotels in China, hotels are still facing some challenges during the rapid development process. Firstly, the usage of high scientific and technological content of service is insufficient. The hotel service programs should reflect technology content, high star-rating hotels facilities have similar quality compared with the same class in international hotels, however, it is still not enough to apply high technology in hotel management. Secondly, economic hotels have little attention. As mentioned before, China will be the number one destination image country all over the world, the number of guest rooms will be the sum of Europe and America. However, Chinese hotel investors and developers pay much attention on high-class hotels market while pay less attention on economic hotels market. Thirdly, it is rather low degree of hotel collectivization. At present, hotel collectivization degree in America has reached about 70%, European countries have reached 30% or so while China has less than 10% hotel collectivization. Finally, there are some problems in the management of human resource in hotels, such as low quality of hotel staff, unreasonable hotel structure and lack pf professional staff in hotels.
Tourism destination image is a key factor to attract tourists. In the 1970s, tourism destination image has been studied and it is getting more and more attention. There are three categories of destination image, they are original image, induced image and compound image. Original image means individuals can get information from education, mass culture, social media and literature review and other ways to form the image of destination. Induced image means advertisements, promotion and broadcasting to promote and advertise destination information which can influence people’s perspective of destination image. Compound image means after tourists go to one specific tourism destination, they have a comprehensive understanding about the destination image with their own experience and previous knowledge.
In this paper, the main objective of the study is to examine the relationship between local hotel experience and tourism destination image and how local hotel experience subsequently affects tourism destination image in the hotel industry in China. Besides, this study can help hotel operators to formulate and implement effective marketing management strategies to deal with the fierce competition in the hotel service industry as well as to improve the tourism destination image by providing customers satisfying hotel experience according to customers’ needs and expectations.
1.2 Research Question
Kearney and Bradley (2009, P.79) correctly state that’ place…cannot be separated from people’. According to Crompton, destination image is usually defined as set of belief, ideas and impressions that people have about some places or destinations (Crompton, 1979). From the point of view of Oxford dictionary, hotel is a commercial establishment providing accommodation, meals, and other services for travelers and tourists. When people have a trip somewhere they need to book a local hotel, the experience of local hotels that visitors have may generate some impacts on their perspective of destination image.
Local hotels are considered as one of the individual experience in tourism destination; a high-quality experience is able to influence not only intention to return and willingness to recommend the country as a tourism destination but is also able to induce more positive intensions toward the products made in the sojourn country (G. Bertoli, 2012). In order to guarantee the enjoyable local hotel experience of customers when they are on vocation in somewhere, hotel service quality, reliability and service satisfaction are vital to make customers happy. In addition, studies have documented that a 5% increase in customer retention can generate a profit growth of 25–95% across a range of industries (Reichheld, 1996; Reichheld & Sasser, 1990). It is the reason that the local hotel industry places a large focus on the guest experience along with their satisfaction about the tourism destination and it is also important to keep high customer retention in order to make high value of loyal customers.
However, there are very few studies dealing with the effect of tourism experience on country image perception (Jaffe and Nebenzahl, 2001), this leads to my research question: what are the impacts of local hotels experience on the tourism destination image?
In the context of tourism, satisfaction with travel experiences contributes to destination loyalty (Alexandris, Kouthouris, & Meligdis, 2006; Bramwell, 1998; Oppermann, 2000; Pritchard & Howard, 1997). The degree of tourists’ loyalty to a destination is reflected in their intentions to revisit the destination and in their willingness to recommend it (Oppermann, 2000). If tourists have a good time in some destination or place, they will recommend it to their friends and revisit the destination Tourists’ positive experiences of service, products, and other resources provided by tourism destinations could produce repeat visits as well as positive WOM effects to friends and/or relatives. Recommendations by previous visits can be taken as the most reliable information sources for potential tourists. Recommendations to other people (WOM) are also one of the most often sought types of information for people interested in traveling.
1.3 Overview of the Study
In the introduction part, background and the purpose of the research will be displayed and from the brief introduction of China hotels and China tourism, it is easier to understand the significance of this study. Besides, according to the introduction and background of the research, the research hypothesis will be listed which will be verified if the hypothesis is right or not from the result of investigation.
And in the literature review part, all related theories about the research will be discussed. All the data that related with the analysis of local hotels on tourism destination image will be discussed with details based on H1, H1, H3, H4, H5.
The third part is about the research methodology in this study. Data collection will be in the form of questionnaire which can provide reasonable evidences for the project.
The next chapter is focusing on data analysis. Base on the data gathered from questionnaires, this thesis would use SPSS21.0 to make a deep analysis.
And then is the conclusion and recommendation part, it will emphasize the significance and purpose of this research and mention effective suggestions for further tourism and hotel management.
In the last part, limitations will be demonstrated in order to better development of the research in the future.
2.1 Concept of Destination Image
Local hotels can be a tourism destination brand which attract more visitors to experience local culture and special things like local cuisine, traditions hospitality of local people and so on and all these staff can give visitors unforgettable memories, different experience as well.
From Crompton’s point of view, image is the sum of beliefs, ideas and impressions which visitors have when they are in a destination (Crompton, 1979). In 1989, Gartner states that “image is a complex combination of various products and associated attributes.” And in other academic writings (Baloglu and Brinberg, 1997, Walmsley and Young, 1998)indicate to regard image as a conceptual idea which composed of two components: perceptive/cognitive evaluations which mean one’s knowledge and belief of an object and affective appraisals related to one’s emotions to the subject.
The destination image will create higher satisfaction in visitors’ mind and the appraise of the destination experience will have effect on the destination image and change it (Chon, 1991). It is an interactional process between destination image and tourists’ satisfaction, if you potential tourists heard that this destination is very worthy visiting from the advertisement, public relations, word-of-mouth recommendations and other means of information, they will have stronger intention to visit the destination, furthermore, when tourists are satisfied with the experience in the tourism destination, they will recommend the destination to their friends or families, and maybe recommend it through social media like Facebook, LinkedIn, Instagram, WeChat and Weibo (Chinese social media software) and so on, and this will build the destination image into a better one.
However, there are a number of researches about image definition while there is no explicitly explanation of image definition, they are all vogue defined in the field of academic writings since various researchers have different ideas to define a subject.
As for the function of destination image, it also influences tourists’ behavioral intentions. Many researchers have studies the topic of the role of image in a tourism destination. Image is an important factor which can positive or negatively affect business activities. Zeithaml and Bitber quoted in Jay (2000, p347) states “image is considered to have the ability to influence customers’ perception of the goods and service offered”. Therefore, image also have the ability to influence customers’ buying behavior. In the terms of customer’s behavior research, a number of researchers have proposed it is multi-staged of customer’s buying process and when consumers want to buy a particular product or service, it should satisfy their need and meet their expectations about the product and service (Kye-Sung Chon, 1990). Berkman and Gilson (1986) have proposed a model of consumer buying process as followed:

 Need recognition Information search Evaluation of alternatives
 Choice of products or service Post-purchase evaluation
 In addition, Court and Lupton (1997) express their argument that destination image can positively influence visitors’ decision and intension about revising somewhere in the later days. In order to make it much clear to see the effect of destination in tourists’ behavioral intentions, Kotler, Bowen and Makens (1996) made a sequence model: image quality satisfaction. In the term of this model, it is obviously to see the relation among image, quality and satisfaction, image would influence customers’ evaluation of quality of product and service they received, and furthermore, the perceived quality would also affect customers’ satisfaction about overall experience. In a word, there is agreement among many researchers considering the effect of tourism image on the behavior of individuals (Ashworth & Goodall, 1988; Mansfeld, 1992).
Based on the above literature, two hypotheses are proposed in the following:
H1: Hotel accommodation experience has positively influences on tourism industry
H2: Tourism destination image has a positive impact on tourism industry
2.2 Concept of service quality and customer satisfaction
First of all, it is necessary to understand what is service quality. Service quality is regarded as an overall evaluation of service by customers (Shirshendu Ganguli Sanjit Kumar Roy, (2010). Service is the foundation of service marketing and service quality is the core of service marketing. Service quality is the key element in the competition of market share among all the corporations whether service quality is in manufacturing corporations with tangible products or in service retail industry. There is difference between the contents of service quality and tangible products quality. Consumers evaluate the service quality not only think about the result of service but also consider the whole service process. Service quality should be identified by consumers and only be accepted by consumers then the service could be said that it has good quality. The components of service quality, forming process, evaluation points and standards are all distinguished from the contents of tangible products.
Service quality can be perceived by consumers, it can be identified and measured by objective methods and more importantly, it can be measured and evaluated by consumers with their subjective thoughts. Service quality can be measured in the process of service production and transaction process and service quality exists when service corporation makes deal with customers, in addition, the development of service quality needs organizations and corporations having effective management and support system. Organizations and corporations should pay much attention to the following elements to better management of service quality.
1. Service level
Good quality does not mean it achieves the highest level of service, administrative staff should decide to get which level of service. When one service satisfies the needs and wants of targeted customers, the service can be said it has good quality.
2. Target customers
Target customers are the people who have desires and needs and they want to have a certain of level of service. With the development of economy, more mature market, more clear division of market, each service has to face different requirement. Corporation and organizations should choose different target customers according to each product and service.
3. Consistency
Consistency is one of the basic requirements of service quality. It requires service providers can maintain the same level of good service quality. The operation of service standards is one of the difficult service quality problems. Service quality relies on employers’ behaviors so different staff have different level of service sense will lead to high possibility of service level inconsistency.
As Lewis and Booms said in 1983, it is an important criterion in service assessment by consumers. Besides, previous literature researches propose that individual service quality elements have a positive effect on both customer satisfaction and customer loyalty, so it is essential to make related service marketing strategies to make customers satisfied with the service they received and then differentiate the organization itself from others.
Many researches show it is common that consumers will compare the performance of product and service to choose a better one. There are a lot of products and service, consumers will make a comparison between different experience and performance of products and service to make a decision whether they will consume them again in the future. When customer have satisfying service, they will recommend the organization to other people while if they have poor service experience, their evaluation and negative assessment will have devastating influence on the related organizations.
Oliver (1993) has made a model in order to make an integration of satisfaction and service quality literatures (see Figure 2.1 modified Satisfaction-service Quality Model). He mentions that while service quality consists of a comparison between ideals and perceptions of performance considering quality dimension, satisfaction is a function of the disconfirmation of predictive expectations regarding both quality dimensions and non-quality dimensions. What’s more, perceived service quality is regard to be a premise to satisfaction. Perceived service quality is considered to be the result of comparison between consumer’s expectations about the service before consuming and their evaluation after actual consuming experience (Asubonteng et al, 1996).
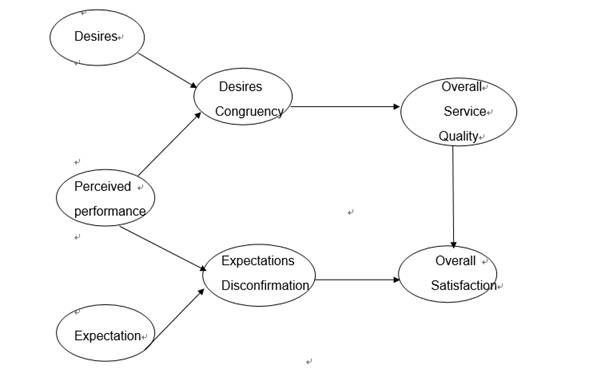
Figure2. 1 Modified Satisfaction-Service Quality Model
Service literature shows lots of factors that indicate image in the customer’s mind (Jay & Dwl, 2000). Image is regarded to affect customers’ minds from the combined influence of advertising, public relations, physical image, word-of-mouth, and their actual experience with the goods and services (Normann, 1991). Similarly, Gronroos (1983), using numerous researches on service organization, found that service quality was the single most important determinant of image. Therefore, Jay and Dwl concluded that a customer’s experience with the products and services is considered to be the most important factor that influences his/her mind considering of image (Jay & Dwl, 2000). And some scholars mention that destination image affects tourists’ subjective perception, consequent behavior, and destination choice (e.g., Baloglu & McCleary, 1999; Castro, Armario, & Ruiz, 2007; Chon, 1990; Echtner & Ritchie, 1991; Milman & Pizarn, 1995; Woodside & Lysonski, 1989). Service is special and it has four dominant characteristics which are intangibility, inseparability, perishability and heterogeneity (Zeithaml, Parasuraman and Berry, 1985).
Intangibility— It means service is not readily displayable and cannot be tested, tried out in advance of purchase (compare with TV, bed, Computer those products which can be used before purchasing). So intangibility of service means less certainty for the customers. Customers need clues to persuade themselves to buy it, therefore, physical evidence is important to present the reliability and quality to make customers do a decision. Physical evidence like price, people, place, equipment, symbols can make intangible service tangible.
Inseparability— It means products and consumption happen in the same time and they can’t be separated.
Perishability— It means service cannot be stored compared with goods.
Heterogeneity— It means it is not able to standardize the service quality and make it consistency across providers or within providers, across time and across delivery centers.
While as Hurley and Estelami (1998) state that, service quality and customer satisfaction have not been explicitly defined or distinguished in the marketing literature. So it is obvious that there is still some confusion about the similarities and differences between these two concepts (J. Enrique Bigne, et al., 2001). Parasuraman, Zeithaml and Berry (1988), quoted in J. Enrique Bigne (2001, p. 608) states “while in the literature on satisfaction expectations are interpreted as prediction, in the literature on quality they are interpreted as wishes or an ideal result.” Moreover, Oliver (1997) points out service quality assessment is more specific (about particular elements or key factors), but customer satisfaction evaluation is more holistic.
For the definition of consumer satisfaction, Giese and Cote (2000) outline three general elements: (1) consumer satisfaction is a response, an emotional or cognitive judgement (emotional response predominating); (2) the response refers to a specific focus (the object of the consumer satisfaction); (3) the response id linked to a particular moment (prior to purchase, after purchase, after consumption, etc.). Giese and Cote (2000), quoted in J. Enrique Bigne (2001, p. 609) states that specific definition of consumer satisfaction need to be made according to the context, taking into account the above dimensions.
According to the literature review, another hypothesis is proposed:
H3: Hotel experience depends on service satisfaction and service reliability
H4: The tourists’ previous experience of accommodation in local hotels significantly influences the perceptual/cognitive and affective components of the perceived image of the tourist destination
2.3 Relationship between customer loyalty and customer behavior
Firstly, it is necessary to understand the definition of customer loyalty. Customer loyalty means the consistency of customer purchasing behavior, it shows the reliability and approvement of products and service and customers will insist purchasing and using the products as well as service in one organization for a long time, it is kind of degree of highly trust and loyalty in cognitive and perceptive aspect, it is also a comprehensive evaluation of advantages in the long time competitive situation from differernt organizations from the perspective of customers. Based on previous research, when there is a 5% increase in loyal customer, the organization can make 25% to 100%.more profits. Therefore, it is a very significant mission for corporate operators to maintain loyal customers.
As mentioned by Anne-Françoise and Audrain-Pontevia (2016), there are a number of academic writings have done the studies that growth in customer satisfaction leads to higher customer loyalty (Picon et al., 2014), then results to higher margin (Oliver, 1999), higher corporation value (Askoy et al., 2008) as well as strategic increase in the future (Malshe and Agarwal, 2015). Customer loyalty is defined as a “customer’s post-consumption evaluation of a product or service” (Mittal and Frennea, 2010, p. 3), and generally speaking, customer satisfaction has been regarded as a powerful predictive element about customer loyalty (Oliver, 1999; Zeithaml, 2000). Many literature review and practical clues show that customers with high satisfying experience and loyalty will buy more goods in a long period of time. (Anderson and Sullivan, 1993) and loyal customers can activate useful word-of-mouth effects on other potential customers (Anderson, 1996), are less sensitive to prices (Fornell et al., 1996), and are more receptive to cross-selling marketing (Fornell, 1992).
With the increasingly marketing competition, customer loyalty is a key factor to influence corporate’s long term profits. It is more meaningful to measure market share from customer loyalty rather than the quantity of customers. Organizations can emphasize the marketing strategies to increase customer loyalty in order to have competitive advantages in the fierce competition among other organizations since there are several benefits to make increase customer loyalty.
(1) Customer loyalty positively consolidate the present market
Organizations with high customer loyalty means a higher barrier for other organizations, because they need invest more money so as to attract original customers and this effort needs a consistent process and this challenge always make competitors weaker, therefore, customer loyalty can protect the present market share effectively.
(2) Customer loyalty positively decrease marketing costs
For loyal customer, organizations just need to care about their benefits and needs, and make them satisfied with the post-purchasing service. It does not cost much but it can bring beneficial results from the word-to mouth effect from loyal customers.
(3) Customers will not choose a new service in a short time
Customer are loyal to one specific organization not just because this organization can meet their needs but more importantly, this organization can provide added values to customer from satisfying service quality.
(4) Customer will not purchase lower products in a short time.
Loyal customers will not turn to buy lower products in a short time since they are less sensitive to prices (Fornell et al., 1996).
From the literature review above, we can see that loyal customers have potential to buy products and service for a long time and they are less changeable to another organization’s products and services, so we might address that there is relationship between customer loyalty and customer behavior.
Based on the definition of customer behavior on Wikipedia, consumer behavior is “The study of individuals, groups. Or organizations and he processes they use to select, secure, use, and dispose of products, services, experiences, or ideas to satisfy needs and the impacts that these processes have on the consumer and society.” Additionally, Michael Solomon (2013, P.6) made a deeper explanation of customer behavior definition, he indicates “consumer behavior is a process in its early stages of development, the field was often referred to as buyer behavior, reflecting an emphasis on the interaction between consumers and products at the time of purchase.”
In 2009, Laura A. Lake proposed a five-stage model of customers making their decision of buying something.
Stage1: Need recognition and awareness: It is the start of having the desire and recognition to buy what they want and having the awareness of what they need.
Stage 2: Searching for information: In the second period, customers will search the related information of the products and services they want and need through various means during the purchase process so as to know much about the products and service to make the purchase decision based on their personal demand.
Stage 3: Evaluating the alternatives: There are a lot of information can be searched, it is confusing for customer to choose the quantity, the price, the color, the design, the material of the product they want, so in this stage, comparison is very common among customers to decide what kind of products they really want and need.
Stage 4: Purchase: After all the above stages of making a decision to buy something, it is the stage to pay for the products and service that customers need.
Stage 5: Post-purchase evaluation: After customers buying the products or service, they will make an evaluation about what they have bought. If there is something wrong with the products and service, they are unsatisfied and may remorse with the purchase which is disadvantageous to attract customers to revisit.
Therefore, customer behavior is not a simple idea to make a decision to buy something while it is a complex process before, during and after the purchasing process.
After the definition and process of customer behavior, it is necessary to understand what factors can influence customer behavior in order to make related marketing business strategy to adopt. Buying behavior is also influenced by cognitive and evaluative components (Verhallen & Raaij Van, 1986). Nowadays, it is very common that people share their accommodation, traveling experience on social media like Facebook, Instagram or in some tourism website. Tripadvisor.com is a good platform for customers to share their hospitality and tourism opinions, as the website itself said that it is ‘‘the largest site for unbiased travel reviews (which) gives you the real story about hotels, attractions, and restaurants around the world. It boasts more than 1,926,031 unbiased reviews and is updated every minute and every day by real travelers; it contains ‘been there, done that’ inside information; and ‘the best deals for your travel dates’’’ (tripadvisor.com, 2005).
It is well known that behavior is governed and controlled by mental activity. Although the needs of customers are diverse and their purchasing behavior is various in the process of marketing business, all these actions are based on their mental activities. The American famous psychologist A·H·Maslow came up with a need hierarch in 1951. He states that there are different degrees of needs when determine to do something (Maslow, 1970). As Figure 2.2 showed below, self-actualization, safety, belongingness, esteem and physiological needs listed according to customer’s different degree of needs. And he indicates that people’s needs are developed from low level to high level, only when their low level’ s needs are satisfied then the high level of their needs will create.
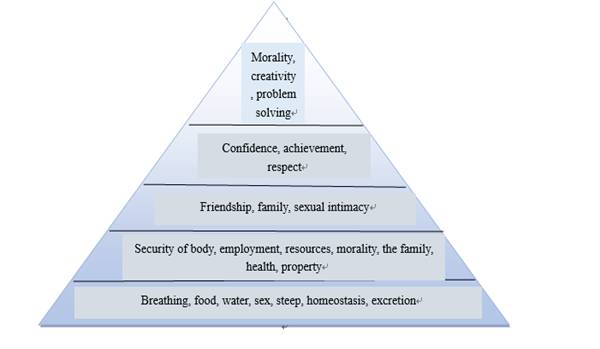
Figure2. 2 Maslow's Need Hierarchy
Hotel image is the image and evaluation of public’s perspective about the hotel management process. If hotels want to have competitiveness and differentiate from other hotels, it is an efficient way to establish a good and special image.
There are some components of hotel image.
(1) Staff image. It includes the image of leaders in hotel, image of public relation employees. Leaders of hotel are the representatives of the hotel; their image indicates the hotel image. If leaders have good image, the hotel image will be better that is called “halo effect” in psychology. In addition, public relation staff in a hotel is not only an organizer but also an executor, they are representatives between hotel and the public to contact and communicate with them directly, therefore, they embody the hotel image in a way. What’s more, other staff often have face to face communication with customers, so they are also an important factor to show the hotel image.
(2) Management image. Hotel is a system management and it is controlled by hotel system. If hotel internal system can operate smoothly which shows the superior management ability can build a good image of hotel management.
(3) Power image. Power image can reflect in hotels facilities like building construction, facilities and equipment and so on, they are hardware to form hotel image. Besides, power image reflects in salary and welfare, if staff has high wage and good welfare which means the hotel has favorable economic benefits. Therefore, economic strength is the material foundation in order to build hotel image.
(4) Products and Service image. Products and service are the most important contents to consumers, they are representatives of hotel image and they can be easily evaluated by consumers, so it is another good way to establish hotel image as well through products and service image.
Staff image, management image, power image, products and service image are the factors to establish hotel image. Moreover, the name of hotel, hotel badge, hotel logo, advertising slogan and other factors are also the composition factors. These factors have interactions with each other to build the hotel image. Hotel image can be built through hotel corporate culture, institutional management and a series of business operation management activities to differentiate itself with other hotels to give a special expression to consumers and the public. The success of the hotel image building concerns the hotel operation performance and management ability, therefore, hotel should pay much attention to the hotel image.
Moreover, there are four characteristics of hotel image.
(1) There are subjective and objective contents of hotel image. In terms of objective part, hotel shows its image in the public invisibly, actually that is the hotel’s concrete objective condition, it includes the internal operation management and external marketing business as well as social activities of hotel. As for subjective part, it includes the judgement and evaluation from the public about the hotel, their judgement and evaluation are connected with their emotions and values, they have interaction.
(2) Hotel image is the comprehensive result from the judgement and evaluation of the public, there are many factors can influence the public’s perspective of the hotel, such as finance capabilities, service quality, environment, location, products quality and other factors. All these are the fundamental components of hotel image, hotel needs to make insistent effort and try their best to make good performance in order to satisfy their customers and leave the most pleasant impression on customers’ mind.
(3) Hotel image has the persistence characteristics which means once the hotel image is built, it is unchangeable in a short period, and once customers have their perspective about the hotel image, it is not easy to change their mind.
(4) The establishment of hotel image depends on various communication media. If hotels want more people know them, they need to use various media to advertise themselves to the public. Therefore, the establishment of hotel image is a communication process of hotel information in a way. Hotels delivery their information to the customer and the public, those people from knowing nothing about the hotel to knowing it, getting familiar with it and having deep impression about the hotel which is the goal of hotel to build its image.
From the above literature review, a good hotel image seems to influence customers’ buying behavior and the public’s loyalty about the products and service. A good hotel image means customers have acceptance of hotels before buying products if customers have loyalty about the hotel and its products which can help hotel gain the trust of market and improve its business reputation.
Therefore, another hypothesis is addressed following:
H5: Hotel image is positively related to customer loyalty.
According to the research topic and usage the current research methods, this thesis mainly applies literature review, questionnaire and statistical analysis methods.
(1) Literature review
Reading and collecting related academic writings, journals, books and websites in order to find useful material to investigate the local hotel condition, tourism destination image, customer loyalty, customer satisfaction and the relationship between the local hotels and tourism destination image in China. Based on the current theories of these parts, research model and hypotheses are listed, questionnaire design is also based on literature review.
(2) Questionnaire
Questionnaire is one of the empirical research means, this thesis’s research method is based on literature review, and design several questions in order to validate the five hypotheses from selecting samples randomly as the investigation targets in the questionnaire, and it mainly to study the evaluation of hotel image, tourists’ satisfaction about the local hotel accommodation experience, tourism destination image, customers’ loyalty of hotel and tourism destination, and then make deeper analysis of the relationship of local hotels and tourism destination image in China.
(3) Statistical analysis
SPSS21.0 will be used to collect and analyze the data. Firstly, reliability and validity analysis will be used to measure if the data collected has high reliability and validity. Then a descriptive analysis will be displayed to show the concrete analysis of the questionnaire data to check whether the five hypotheses are right or not.
It is a new research topic of “An Analysis of Local Hotels on Tourism Destination Image in China” with a lot of influential factors, several means and methods will be applied in the paper to investigate whether the hypothesis proposed are right or not. In the introduction part, purpose and significance of the research are mentioned, and related theories in the literature review part, research model, questionnaire development, sample and data collection as well as data analysis will be presented in the methodology part.
3.1 Sample and data collection
The research instrument is based on literature review, and a questionnaire has been designed for collecting sample information and data. Questionnaire is a common method to collect data through various people from different ages, occupations, genders and so on. There are several advantages of applying a questionnaire to collect data. Firstly, it saves time, human resource and energy to collect hundreds or thousands of information, and what’s more, the results can be quantitative in order to do the analysis part. Questionnaire is a structured investigation method which the questions, answers and forms of expression are constant, and they are presented by verbal description, therefore, it is easily to do quantitative analysis. Thirdly, the results can be clearly and easily processed by using software to collect and analyze. Fourthly, questionnaire can be given out to large-scale targets which provide researchers more accurate information about the thoughts, behaviors and attitudes of people participated in the questionnaire. So questionnaire is an appropriate means to do the research and collect related information.
Hotels were sampled from China and 18 questions proposed in the questionnaire which is designed to target at Chinese tourists, so the questionnaire is in Chinese so as to make more Chinese tourists understand the questions and involved in the questionnaire. The Chinese version of questionnaire can be reached in the https://sojump.com/jq/9796936.aspx which is a Chinese website to design questionnaire. Respondents were randomly invited to complete the survey by posting and forwarding the link of questionnaire to in social media platform in order to involve more people to complete the questionnaire. Data and the related English version of questionnaire will be seen in the appendix. In the end, 169 responders fulfilled the questionnaire after two days in September 2016, and all the questionnaire had no problems with a response rate of 100% so they are all valid after checking. The sample had more female (n=112) than male (n=57).
3.2 Questionnaire development
Based on the five hypothesis proposed in the literature review part, all the 18 questions are related to the hypothesis in order to validate whether the hypothesis is right or not.
First of all, basic information about responders’ gender, age, frequency of travelling as showed in the table 3.1.
|
Item |
Category |
|
Q1: Gender |
A: Male
B: Female |
|
Q2: Age |
A: Under 20
B: 20-35
C: 36-50
D: 51-65
E: Over 66 |
|
Q4: Frequency of travelling |
A: One time in a year
B: 2-3 times in a year
C: 4-5 times in a year
D: Over 6 times in a year |
Table 3. 1 Basic information in the questionnaire
Next part is about the variables for the study which related to the five hypotheses and the related questions are designed in the table 3.2.
|
Item |
Category |
Related Variable |
Related Hypothesis |
|
Q5: What kind of hotel do you book when you are on holiday? |
A. Hostels
B. Budget Hotels
C. Comfortable Hotels
D. Upper-class Hotels
E. Luxury Hotels |
Hotel image |
H5 |
|
Q6: What do you care most about when you choose hotels? (1-5 means degree, 1 is the least important, 5 is the most important) |
1. 2. 3. 4. 5.
A. Location
B. Environment
C. Equipment
D. Price
E. Service
F. Brand awareness
G. Transportation
|
Hotel image |
H5 |
|
Q7: Are you satisfied with the previous local hotel’s accommodation experience? |
A. Strongly satisfied
B. Satisfied
C. Neutral
D. Unsatisfied
E. Strongly unsatisfied |
Previous hotel accommodation experience |
H1, H4 |
|
Q8: Are you satisfied with the local hotel service? |
A. Strongly satisfied
B. Satisfied
C. Neutral
D. Unsatisfied
E. Strongly unsatisfied |
Service satisfaction and service reliability |
H3 |
|
Q9: How do you feel about the local hotel image? |
A. Strongly satisfied
B. Satisfied
C. Neutral
D. Unsatisfied
E. Strongly unsatisfied |
Hotel image |
H5 |
|
Q10: How long will you spend in local hotels when travelling? |
A. Within 2 days
B. 3-5 days
C. 5-7 days
D. 7-9 days
E. Over 10 days
F. It depends |
Service satisfaction and service reliability |
H3 |
|
Q11: Are you satisfied with local hotel price? |
A. Strongly satisfied
B. Satisfied
C. Neutral
D. Unsatisfied
E. Strongly unsatisfied |
Service satisfaction and service reliability |
H3 |
|
Q12: How long will you stay in the local hotel when you are in a tourism destination? |
A. Within 2 days
B. 3-5 days
C. 6-8 days
D. 9-11days
E. Over 12 days |
Customer loyalty |
H5 |
|
Q13: Do you agree accommodate in local hotel can help you know more about the tourism destination? |
A. Strongly agree
B. Agree
C. Neutral
D. Disagree
E. Strongly disagree |
Previous hotel accommodation experience |
H1, H4 |
|
Q14: Are you satisfied with the image of the tourism destination where you have been to? |
A. Strongly satisfied
B. Satisfied
C. Neutral
D. Unsatisfied
E. Strongly unsatisfied |
Tourism destination image |
H2 |
|
Q15: Will you go to the same destination for traveling again next time? |
A. Yes
B. No |
Customer loyalty |
H5 |
|
Q16: Do you agree if you have satisfying accommodation experience in local hotel will attract you revisit the tourism destination? |
A. Strongly agree
B. Agree
C. Neutral
D. Disagree
E. Strongly disagree |
Customer loyalty |
H5 |
|
Q17: Do you agree if you have satisfying accommodation experience in local hotel will attract you accommodate in the same local hotel again? |
A. Strongly agree
B. Agree
C. Neutral
D. Disagree
E. Strongly disagree |
Customer loyalty |
H5 |
Table 3. 2 Questions and related variables in the questionnaire
Despite of the above questions listed in table 2, there are two more open questions designed, they are Q18: “What can be improved in local hotels where you accommodate during your vacation? (location, price, catering, amenities, entertainment, etc.)” and Q19: “What service do you want during your staying in local hotels when travelling?” in order to check the validity of hypotheses and variables.
In the data analysis part, qualitative and quantitative analysis will be applied to analyze the data collected from questionnaire. Qualitative analysis and quantitative analysis should be consolidated and complementary. Qualitative analysis is the premise of quantitative analysis, quantitative analysis will be useless and invaluable if there is no qualitative analysis. Quantitative analysis makes qualitative analysis more accurate and makes qualitative analysis into deeper analysis. And in the data analysis part, software SPSS21.0 will be applied so as to verify five hypothesizes scientifically and accurately.
4.1 Reliability and Validity Analysis
After collecting all the questionnaire, the questionnaire results indicated that both reliability and validity of the questionnaires were fair ideal after the reliability and validity analysis.
4.1.1 Reliability Analysis
A reliability analysis was made on the whole data of questionnaire collected. Cronbach’s Alpha is between 0 to 1, if Cronbach’s Alpha is closer to 1 which means the reliability of the questionnaire is high. Through the data analysis of questionnaire, we can see that reliability of the collected questionnaire equals 0.740 from table 4.1 which means the questionnaires have high reliability.
|
Cronbach's Alpha |
N of Items |
|
.740 |
21 |
Table 4. 1 Reliability Statistics
4.1.2 Validity Analysis
Similarly, a validity analysis was also made on the whole data of questionnaire collected. KMO is between 0 to 1, if KMO is closer to 1 which means the validity of the questionnaire is high. Through the data analysis of questionnaire, we can see that KMO of the collected questionnaire is 0.755 from table 4.2 which means the questionnaires have high validity.
|
Kaiser-Meyer-Olkin Measure of Sampling Adequacy. |
.755 |
|
Bartlett's Test of Sphericity |
Approx. Chi-Square |
1006.417 |
|
df |
210 |
|
Sig. |
.000 |
Table 4. 2 KMO and Bartlett's Test
4.2 Descriptive Analysis
As Perry, Marc J. & Mackun, Pail J (2001) state that demography is the statistical and mathematical study of the size, composition, and spatial distribution of human populations and how these figures change over time. In the demographic description part, gender, age and frequency of travelling will be explained with detail as followed.
Table 4.3 shows the proportion of gender and it is clearly to see in all the respondents, female (66.3%) has higher proportion than male (33.7%). There is a little big difference between the proportion of female and male respondents.
Q1: What’s your gender?
|
Gender Distribution |
Frequency |
Percent |
|
Valid |
Male |
57 |
33.7 |
|
Female |
112 |
66.3 |
|
Total |
169 |
100.0 |
Table 4. 3 Gender Distribution
And in the age distribution of the respondents (see table 4.4), 21-35 years of age accounted for the highest, accounted for 88.8%, followed by under 20 years old which has proportion of 7.7%, most of these people under 20 years old are students who has relatively lower consumption power while these who aged 21-35 people have their own job and have ability as well as strong desire, leisure time to spend some days in somewhere. However, there are only four people aged 36-50 involved in the questionnaire and it accounts for 2.4%, while there are only two people over 50 years old respondents and it accounts for less than 1.2% which means there are more teenagers and young people were involved in the investigation.
|
Q2: What’s your age group? |
|
Age Distribution |
Frequency |
Percent |
|
Valid |
Under 20 |
13 |
7.7 |
|
21-35 |
150 |
88.8 |
|
36-50 |
4 |
2.4 |
|
51-65 |
1 |
.6 |
|
Over 66 |
1 |
.6 |
|
Total |
169 |
100.0 |
Table 4. 4 Age Distribution
From table 4.5 we can see that in the question of how often people will go to travel, people are on holiday 2-3 times a year have the highest proportion of 54.4%, 33.1% people go to travel once a year, 7.7% people go travelling 4 to 5 times a year and 4.7% people spend their holidays more than six times a year, we can conclude that most of the respondents go to travel less than three times a year, people do not travel a lot in a year and they prefer short staying in one destination.
|
Q4: How often do you go to travel? |
|
Travel Frequency |
Frequency |
Percent |
|
Valid |
One time in a year |
56 |
33.1 |
|
2-3 times in a year |
92 |
54.4 |
|
4-5 times in a year |
13 |
7.7 |
|
Over 6 times in a year |
8 |
4.7 |
|
Total |
169 |
100.0 |
Table 4. 5 Travel Frequency
In the table 4.6, it is clear to know that most respondents tend to choose budget hotel which have proportion 52.7% and 32.5% respondents are fond of staying in comfortable hotels while few people choose accommodating in hostels, upper-class hotels as well as luxury hotels. It maybe because most Chinese people do not want to spend too much money on accommodation fees, they prefer economic, comfortable hotels to spend their holidays rather than upper-class, luxury hotels which are high level and cost them much than budget and comfortable hotels.
|
Q5: What kind of hotel do you book when you are on holiday? |
|
Hotel Types |
Frequency |
Percent |
|
Valid |
Hostels |
16 |
9.5 |
|
Budget Hotels |
89 |
52.7 |
|
Comfortable Hotels |
55 |
32.5 |
|
Upper-class Hotels |
8 |
4.7 |
|
Luxury Hotels |
1 |
.6 |
|
Total |
169 |
100.0 |
Table 4. 6 Hotels Types
4.3 Regression Analysis
In order to validate the hotel service has influence on hotel accommodation experience, regression analysis is applied to do the analysis. In the table 4.7 we can see that R Square value is 0.251 in the regression model and Sig value is 0.00 in the F validity which means the regression model is appropriate to use.
|
Q8: 8. Are you satisfied with the local hotel service? |
|
Model |
R |
R Square |
Adjusted R Square |
Std. Error of the Estimate |
F |
Sig. |
|
1 |
.501a |
.251 |
.247 |
.530 |
55.997 |
.000b |
|
a. Predictors: (Constant) |
|
|
Table 4. 7 Model Summary
From the perspective of coefficients (see table 4.8), the Sig value of local hotel service coefficient is less than 0.05 which means local hotel service index has validity and it indicates that local hotel service can generate significant influence on hotel accommodation experience. In addition, we can see that from in coefficient B, it is 0.462 considering the satisfaction of hotel service which means hotel service satisfaction have positively effects on local hotel accommodation experience, in simple words, it shows that the better of the hotel service, the higher satisfaction of accommodation experience.
|
Q7: Are you satisfied with the previous local hotel’s accommodation experience? |
|
Model |
Unstandardized Coefficients |
Standardized Coefficients |
t |
Sig. |
|
B |
Std. Error |
Beta |
|
1 |
(Constant) |
1.861 |
.210 |
|
8.867 |
.000 |
|
Are you satisfied with the previous local hotel’s accommodation experience? |
.462 |
.062 |
.501 |
7.483 |
.000 |
|
a. Dependent Variable: |
Table 4. 8 Coefficient Analysis
Moreover, with the purpose of analyzing the influence of hotel image on customer loyalty, correlation analysis was applied to do the research. As data showed in table 4.9, sig value is more than 0.05 which means this questionnaire results did not pass the significance test and its correlation coefficient is 0.13 which means the positive correlation is weak.
|
Q9: How do you feel about the local hotel image?
Q17: Do you agree if you have satisfying accommodation experience in local hotel will attract you accommodate in the same local hotel again? |
|
|
17. Do you agree if you have satisfying accommodation experience in local hotel will attract you accommodate in the same local hotel again? |
9. How do you feel about the local hotel image? |
|
17. Do you agree if you have satisfying accommodation experience in local hotel will attract you accommodate in the same local hotel again? |
Pearson Correlation |
1 |
.130 |
|
Sig. (2-tailed) |
|
.092 |
|
9. How do you feel about the local hotel image? |
Pearson Correlation |
.130 |
1 |
|
Sig. (2-tailed) |
.092 |
|
Table 4. 9 Correlations
A regression model is applied to study the effects of local hotel accommodation experience on tourism destination image. From table 4.10 we can conclude that R Square value is 0.194 and Sig value is 0.00 in the F validity in regression model, therefore, the whole regression model is valid.
Q7: Are you satisfied with the previous local hotel’s accommodation experience?
|
|
Model |
R |
R Square |
Adjusted R Square |
Std. Error of the Estimate |
F |
Sig. |
|
1 |
.440a |
.194 |
.189 |
.615 |
40.075 |
.000b |
|
a. Predictors: (Constant) |
|
|
Table 4. 10 Model Summary
From the perspective of coefficients, sig value of hotel accommodation experience is less than 0.05 which means the coefficient passes the t test and indicates that hotel accommodation experience has significant influence on tourism destination image. Besides, from coefficient B showed in table 4.11 is 0.492 which means hotel accommodation experience has positive effects on tourism destination image, in a word, if customers have much satisfying accommodation experience in hotels, they are more satisfied with the tourism destination image.
|
Q14: Are you satisfied with the image of the tourism destination where you have been to? |
|
Model |
Unstandardized Coefficients |
Standardized Coefficients |
t |
Sig. |
|
B |
Std. Error |
Beta |
|
1 |
(Constant) |
1.830 |
.268 |
|
6.817 |
.000 |
|
7.Are you satisfied with the previous local hotel’s accommodation experience? |
.492 |
.078 |
.440 |
6.330 |
.000 |
|
a. Dependent Variable |
Table 4. 11 Coefficients a
In order to validate hypothesis 2 whether tourism destination image has influence on tourism industry or not, logistic regression analysis is applied in this part because the questions in questionnaire was asked respondents whether they will go to the same tourism destination again and the choices were set to 0 and 1. After the analysis, we can see the data showed in table 4.12, Cox& Snell R Square value is 0.043 and Nagelkerke R Square value is 0.058.
|
|
Step |
-2 Log likelihood |
Cox & Snell R Square |
Nagelkerke R Square |
|
1 |
219.562a |
.043 |
.058 |
Table 4. 12 Model summary
We can see that in table 4.13, the sig of tourism destination image is less than 0.05 which means the result is valid and its coefficient is -0.647, it indicates that tourism destination image has negative influence on tourism industry.
|
Q14: Are you satisfied with the image of the tourism destination where you have been to? |
|
|
B |
S.E. |
Wald |
df |
Sig. |
Exp(B) |
|
Step 1a |
1. @13. Are you satisfied with the image of the tourism destination where you have been to? |
-.647 |
.245 |
6.961 |
1 |
.008 |
.523 |
|
Constant |
1.830 |
.863 |
4.501 |
1 |
.034 |
6.236 |
|
a. Variable(s) entered on step 1: @14. Are you satisfied with the image of the tourism destination where you have been to? |
Table 4. 13 Variables in the Equation
A logistic regression model is also used to study the effects of hotel accommodation experience on tourism industry (see table 4.14). R Square value is 0.057 and sig value of F validity is less than 0.05 so the results pass the F validity and the regression model is valid.
Table 4. 14 Model Summary
Sig value of hotel accommodation experience is less than 0.05 (see table 4.15) which shows the validity of t test and it indicates that hotel accommodation experience has dominant influence on tourism industry. From the perspective of coefficient B which is 0.362, it means hotel accommodation experience has positive effects on tourism industry and simply speaking, it means if customers have better hotel accommodation experience, it is more beneficial for local tourism industry.
|
Q16: Do you agree if you have satisfying accommodation experience in local hotel will attract you revisit the tourism destination? |
|
Model |
Unstandardized Coefficients |
Standardized Coefficients |
t |
Sig. |
|
B |
Std. Error |
Beta |
|
1 |
(Constant) |
2.052 |
.394 |
|
5.203 |
.000 |
|
7. Are you satisfied with the previous local hotel’s accommodation experience? |
.362 |
.114 |
.239 |
3.175 |
.002 |
|
a. Dependent Variable: 16. Do you agree if you have satisfying accommodation experience in local hotel will attract you revisit the tourism destination? |
Table 4. 15 Coefficients
In a word, from the descriptive and regression analysis of the dated collected, the hypotheses testing results can be found in table 4.16. It is clear to see that service satisfaction and service reliability are dominant to hotel experience and hotel accommodation experience has positive influence on tourism industry, in addition, previous accommodation experience significantly affects the perceptual, cognitive and affective components of the tourism destination image. However, there are two hypotheses are not supported, it seems like there is no positive relation between tourism destination image and tourism industry as well as there is no positive relation hotel image and customer loyalty.
|
Number |
Hypothesis |
Result |
|
1 |
Hotel accommodation experience ---Tourism industry |
Supported |
|
2 |
Tourism destination image --- Tourism industry |
Not supported |
|
3 |
Hotel experience --- Service satisfaction and service reliability |
Supported |
|
4 |
Previous accommodation experience --- Tourism destination image |
Supported |
|
5 |
Hotel image ---Customer loyalty |
Not supported |
Table 4. 16 Hypotheses testing results
Nowadays, people pay much attention on service marketing, and there are many literature view have studied the relationship between service satisfaction and customer loyalty, and a number of researches have proved that service satisfaction has positive influence on customer loyalty while it seems that little studies are about the relationship between customer loyalty and image. Findings in the methodology and analysis part show that good experience of a hotel accommodation established from service satisfaction and service reliability, when customers have satisfying accommodation experience in hotel they are potential to be loyal customers to revisit the same hotel and the same tourism destination for travelling which highlight the hotel management operator to focus on seven Ps service marketing contents, they are people, price, promotion, people, place, physical evidence, process in order to satisfy customers from every needed aspect, since customers are importance factors to establish the hotel image, it is essential to make related business strategies to m, ake them happy with everything during their staying in hotels for their further recommendation and revisiting.
For theoretical implications of the study, there are some antecedent theoretical theories are referenced, and after the research, some findings are concluded which can be adopted in other authors’ works for their references in the future.
For the managerial implication of this study, since it is proved that hotel accommodation experience has positively influence on tourism industry, hotel experience depends on service satisfaction and service reliability and the tourists’ previous hotel accommodation experience in local hotels significantly influences the perceptual, cognitive and affective components of the perceived tourism destination image, this study can be helpful in hotels and tourism industry or other service sectors with useful hotel, tourism management knowledge. Tourists’ perspective of tourism destination is positively influenced by hotel accommodation experience, and it is long-term process to maintain customer retention, so making relative business marketing strategies is important. WOM communication is also an effective way to build good image of local hotel and tourism destination image since tourists will share their own experience after the trips, therefore, making tourists satisfied with their staying in one place is dominant for hotels and destination marketers. It is not possible to handle all the process and factors that influence the image of local hotels and tourism destination image but marketers can control some of the key elements to satisfy tourists, like advertising and making promotion in order to attract more tourists, monitoring service quality to satisfy customers, having related tourism events or architecture such as cultural festivals, entertainment facilities, convenient transportation, beautiful environment surround to relax them and so on. Their friends and families are more easily persuaded by their recommendation and evaluation, therefore, business marketer should pay more attention to the shaping of tourism destination and the service quality of local hotel conveyed to customers so as to these elements will influence their satisfaction and affect their desire to revisit the local hotel and tourism destination in the future.
The strength of this research is that it gives disciplines and suggestions for marketers to make relative strategies to gain competitive advantages and gain more market share. In order to improve customer satisfaction, customer loyalty, service quality and destination image in hotel and tourism industry, there are some suggestions and advice for marketers.
1. Provide high quality and reasonable priced products. When purchasing products, customers mainly concentrate on products’ quality and service as well as price, if they are satisfied with these elements, they will be satisfied with the products and be loyal to the products and the corporations. Quality is an important factor which influence customers’ satisfaction, because the quality of products directly affects customers’ evaluation of products, and more importantly, it is the key point to gain market share for organizations and corporations. What’s more, products with reasonable price is a basic requirement for most of customers. If products have reasonable price on the basis of high quality which can contribute to improve the customer satisfaction of products. Satisfied customers are willing to pay more to purchase the products and service they like.
2. Provide customized service to satisfy customers. First of all, it is necessary to have the desire and purpose to make customers satisfied and establish customer oriented corporation culture to make every staff know the importance of making customers satisfied. In order to establish this kind of culture, it is dominant to make strong promotion to make employees understand the meaning of customer oriented culture to corporations and individuals. Besides, organizations’ senior management staff should have clear concept, make relative strategies and set an example then they can coach their staff how to satisfy customers and make customers revisit. What’s more, it is necessary to train employees the skills of satisfying customers, improve their ability to service customers.
3. It is not enough just to meet customers’ needs and make them satisfied. Sales people know much better what customers really want. Therefore, some corporations and organizations can provide products and service which customers never think about and do something that customers cannot do, if corporations and organizations can do these things, they have more opportunities to make their customers satisfied and make customers loyal to the products and service.
4. Build hotel and tourism destination image to attract more customers. In the era of product homogeneity, it is essential to build organization’s own image to gain market share and attract customers to visit. A good image of an organization can decrease purchasing risk, increase purchase confidence. A good image can influence customers’ choices, preference and decisions, it is easier to make customers loyal to one specific brand.
5. Build customer database, communicate with customers in time to solve their problems. The harmonious relationship between organizations and customers can improve customers’ satisfaction. Hotels and tourism destination can make loyalty program to attract more loyal customers to return and customer clubs to organize various activities to invite customers to attend.
The weakness of this research is that the questionnaire is designed for Chinese tourists and the market researched is in China, so it may be not suitable for other countries’ hotel management and tourism industry.
Several limitations exist in the results of the thesis. In order to make this part clear, the limitations will be listed in terms of number of respondents, main targeted market, factors influencing customers’ experience in local hotels and perceptions of tourism destination image, methodology, software used to analyze the data.
1. There is innumerable literature review can be reached and referenced, while in this study, only some specific related literature review is applied to the research in order to make the five hypotheses and understand the previous studies of other authors for referencing. From the previous studies, a knowledge gap has been found and an appropriate way has been used trying to validate the hypotheses. However, it still has space to read more literature review and know deeper about the previous studies for comprehensive understanding about the research field for the purpose of making related hypotheses, listing factors which influencing tourists’ experience of staying in local hotel and their perspective about the tourism destination image.
2. 169 respondents have involved in the questionnaire survey during two days while the number of the respondents is a little less which has the possibility making the answers of the questionnaire is not too accurate and representative. Moreover, it cannot assure that every respondent answer the questions truthfully which means they may give fake response to the questions or some people may not read the questions carefully and choose some answers randomly which in the later data analysis part may make the results have the risk of getting reverse outcome. In additionally, there are only 169 respondents are required to take part in the questionnaire, they cannot represent all the Chinese, so the results may not one hundred percent precise and generalized in this research. Therefore, there should be more people are invited to take participate in the questionnaire in longer days of collecting data in order to make the sample more convincible and the results more helpful and meaningful.
3. What’s more, the questionnaire focuses on China, all the respondents are Chinese, all the data collected and thesis finished in China which means the population of the study limited to visitors who have been to a tourism destination in China. So the results and data analysis is relatively suitable for Chinese market rather than other countries considering different countries have various culture background and national conditions. In further study, other countries’ tourism destinations should be considered in the thesis in order to get comprehensive findings.
1. Anderson, E.W. (1996). Consumer satisfaction and word of mouth. Journal of Service Research, Vol. 1 No. 1, pp. 5-17.
2. Anderson, E.W. and Sullivan, M. (1993). The antecedents and consequences of customer satisfaction for firms. Marketing Science, Vol. 16 No. 2, pp. 125-143.
3. Alexandris, K., Kouthouris, C., & Meligdis, A. (2006). Increasing customers’ loyalty in a skiing resort: The contribution of place attachment and service quality. International Journal of Contemporary Hospitality Management, 18(5), 414–425.
4. Anne-Françoise, Audrain-Pontevia and Marc Vanhuele. (2016). Where do customer loyalties really lie, and why? Gender differences in store loyalty. International Journal of Retail & Distribution Management, Vol. 44 Iss 8 pp. 799 – 813.
5. Askoy, L., Cooil, B., Groening, C., Keiningham, T.L. and Yalçin, A. (2008). The long-term stock market valuation of customer satisfaction. Journal of Marketing, Vol. 72 No. 4, pp. 105-122.
6. Ashworth, G., & Goodall, B. (1988). Tourist images: marketing considerations. In: B. Goodall, & G. Ashworth (Eds.), Marketing in the tourism industry The promotion of destination regions. London: Routledge, pp. 213–238.
7. Asubonteng, P., McCleary, K.J. and Swan, J.E. (1996). SERVQUAL revisited: a critical review of service quality. The Journal of Services Marketing, Vol. 10 No. 6, pp. 62-81.
8. Baloglu, S., and D. Brinberg (1997). Affective Images of Tourism Destination. Journal of Travel Research, 35 (4), 11–15.
9. Baloglu, S., & McCleary, K. W. (1999). A model of destination image formation. Annals of Tourism Research, 26 (4), 864-897.
10. Berkman, Harold W. and Christopher Gilson (1986). Consumer Behavior:
Concepts and Strategies, Boston: Kent Publishing Company.
11. Bramwell, B. (1998). User satisfaction and product development in urban tourism. Tourism Management, 19(1), 35–47.
12. Castro, C.B., Armario, E.M., & Ruiz, D.M. (2007). The influence of market heterogeneity on the relationship between a destination’s image and tourists’ future behavior. Tourism Management, 28, 175-187.
13. Chon, K. S. (1990). The role of destination image in tourism: A review and discussion. Tourist Review, 45(2), 2-9.
14. Chon, K. (1991). Tourism Destination Image Modification Process. Tourism Management, 12, 68–72.
15. Crompton, J. L. (1979). A system model of the tourist’s destination selection decision process with particular reference to the role of image and perceived constraints. College Station: Texas A & M University. Unpublished Ph.D. Dissertation.
16. Crompton, J. L. (1979). An assessment of image of Mexico as a vacation destination and the influence of geographical location upon that image. Journal of travel research, 17(4), 18-3.
17. Echtner, C. M., & Ritchie, J. R. B. (1991). The meaning and measurement of destination image. The Journal of Tourism Studies, 2(2), 2-12.
18. Filipova M. K. (2016). Influence of leadership competences on the
manager’s activities in hotel business. Economic Processes Management: International Scientific E-Journal, epm.fem.sumdu.edu.ua, 1.
19. Fornell, C. (1992). A national customer satisfaction barometer: The
Swedish experience. Journal of Marketing, Vol. 56 No. 1, pp. 6-21.
20. Fornell, C., Johnson, M.D., Anderson, E.W., Cha, J. and Bryant, B.E.
(1996). The American customer satisfaction index: value, purpose and findings. Journal of Marketing, Vol. 60, No. 4, pp. 7-18.
21. Gartner, W. C, (1989). Tourism image: Attribute to measurement of state
tourism products using Multidimensional scaling techniques. Journal of Travel Research. 28(2) (Fall), 16-20.
22. Giese, J. L., & Cote, J. A. (2000). Defining consumer satisfaction.
Academy of Marketing Science Review. Available at http://www.amsreview.org/amsrev/theory/giese00-01.html [Accessed 2000].
23. Gronroos, C. (1983). Strategic Management and Marketing in the Service Sector, Cambridge, MA.
24. Reichheld, F. F. (1996). The loyalty effect. Boston, MA: Harvard Business School Press.
25. Reichheld, F. F., & Sasser, W. E. (1990). Zero defections: Quality comes to services. Harvard Business Review, 68(September/October), 105–111.
26. Jaffe, Eugene D. and Israel D. Nebenzahl. (2001). National Image and Competitive Advantage, Copenhagen: Copenhagen Business School Press.
27. Jay Kandampully & Dwi Suhartanto, (2000). Customer loyalty in the hotel
industry: the role of customer satisfaction and image. International Journal of Contemporary Hospitality Management, Vol. 12 Iss 6 pp. 346 – 351.
28. J. Enrique Bigne, M. Isabel Sanchez, Javier Sanchez. (2001). Tourism
image, evaluation variables and after purchase behavior: inter-relationship. Tourism Management, 22, 607–616.
29. Kearney, A. and J.J. Bradley. (2009), “Too strong to ever not be there”: place names and emotional geographies, Social & Cultural Geography, 10(1), 77-94.
30. Kye-Sung Chon. (1990), “The role of destination image in tourism: A
review and discussion”, The Tourist Review, Vol. 45 Iss2 pp. 2 – 9.
31. Kyurova, V. (2011). Seasonality and Competitiveness in Hotel Business,
dissertation paper, “N. Rilski” SWU, Blagoevgrad, 15.
32. Laura A. Lake, 2009. Consumer Behavior for Dummies. Canada: Hoboken, Wiley Publishing, Inc.
33. Lewis, R.C. and Booms, B.H. (1983), “The marketing aspects of service quality”, in Berry, L.L., Shostack, G.L. and Upah, G.D. (Eds), Emerging Perspectives on Services Marketing, American Marketing Association, Chicago, IL, pp. 99-104.
34. Madgerova, Р. (2013). Entrepreneurship in Hotel Business-conditions and problems, Univ. Publ, “N. Rilski”, Blagoevgrad, 17.
35. Malshe, A. and Agarwal, M.K. (2015). From finance to marketing: the impact of financial leverage on customer satisfaction. Journal of Marketing, Vol. 79 No. 5, pp. 21-38.
36. Maslow, A. H., 1970. Motivation and personality. 2nd ed. New York: Harper
&Row.
37. Mansfeld, Y. (1992). From motivation to actual travel. Annals of Tourism Research, 19, 399–419.
38. Michael Solomon, Gary Bamossy, Søren Askegaard, Margaret K. Hogg.
(2013). Consumer Behavior 5th edn. Pearson Education.
39. Milman, A., & Pizarn, A. (1995). The role of awareness and familiarity with a destination: The central Florida case. Journal of Travel Research, 33(3), 21-27.
40. Mittal, V. and Frennea, C. (2010). Customer Satisfaction: A Strategic Review and Guidelines for Managers. MSI Fast Forward Series, Marketing Science Institute, Cambridge, MA.
41. Normann, R. (1991), Service Management: Strategy and leadership in Service Business, John Wiley & Sons.
42. Oliver, Richard L. (1993). A Conceptual model of Service Quality and Service Satisfaction: Compatible Goals, Different Concepts. Advances in Services Marketing and Management, Vol. 2, 65-85.
43. Oliver, R. L. (1997). Satisfaction: A behavioral perspective on the consumer. New York: McGraw-Hill.
44. Oliver, R.L. (1999). Whence consumer loyalty? Journal of Marketing, Vol. 63, Special Issue, pp. 33-44.
45. Oppermann, M. (2000). Tourism destination loyalty. Journal of Travel
Research, 39(1), 78–84.
46. Parasuraman, A., Berry, L., & Zeithaml, V. A. (1991). Refinement and
reassessment of the SERVQUAL scale. Journal of Retailing, 67(4), 420–450.
47. Perry, Marc J. & Mackun, Paul J. (2001). Population Change &
Distribution: Census 2000 Brief.
48. Picon, A., Castro, I. and Roldan, J.L. (2014). The relationship between
satisfaction and loyalty: a mediator analysis. Journal of Business Research, Vol. 67 No. 5, pp. 746-751.
49. Pritchard, M., & Howard, D. R. (1997). The loyal traveler: Examining a typology of service patronage. Journal of Travel Research, 35(4), 2–10.
50. Shirshendu Ganguli Sanjit Kumar Roy. (2010). Service quality dimensions of hybrid services. Managing Service Quality: An International Journal, Vol. 20, 404 – 424.
51. Tripadvisor.com (2005). Available at /http://tripadvisor.com [Accessed 2005].
52. Verhallen, T. M. M., & Raaij Van, W. F. (1986). How consumers trade off behavioral costs and benefits. European Journal of Marketing, 20(3/4), 19–34.
53. Walmsley, D., and M. Young (1998). Evaluative Images and Tourism: The Use of Personal Constructs to Describe the Structure of Destination Images. Journal of Travel Research, 36 (3), 65–69.
54. Woodside, A. G., & Lysonski, S. (1989). A general model of traveler destination choice. Journal of Travel Research, 27(4), 8-14.
55. Zeithaml, V. (2000). Service quality, profitability, and the economic worth of customers: what we know and what we need to learn. Journal of the Academy of Marketing Science, Vol. 28 No. 1, pp. 67-85.


